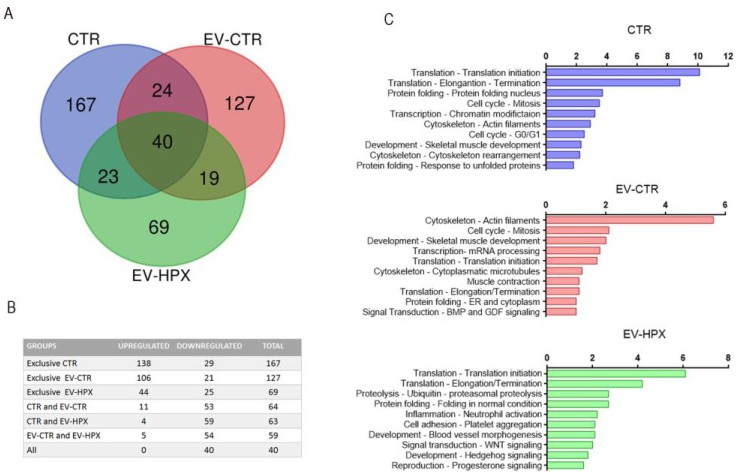
Fig. 4. EV CTR and EV HPX trigger different biological process inside renal tubule cells submitted to ATP depletion injury. Venn diagram from proteomic analyses shows the number of identified proteins differentially expressed in renal cells in all experimental groups under injury due to ATP depletion (INJ), where CTR indicates the condition in which cells were not ATP depleted, EV CTR indicates ATP depleted cells followed by 24 h incubation with EV CTR, and EV HPX indicates ATP depleted cells followed by 24 h incubation with EV HPX (A). The table shows the number of proteins upregulated and downregulated under all experimental conditions in respect to the injury condition (INJ) (B). Identification, by METACORE analysis, of biological processes associated with the proteins differentially expressed in the 3 different groups (CTR, EV CTR, EV HPX) in respect to the injury condition (C). Abbreviations: EV, extracellular vesicles, CTR, control; HPX, hypoxia.